Companion to Chapter 10. Chapter 10 treats Power BI’s four AI-labeled visuals as sources of claims, not findings — each output is a hypothesis the analyst tests before it becomes a report claim. Each visual earns a specific per-visual verification move: the confound check for Key Influencers, the business-context walk for Anomaly Detection, the filter-clear re-walk for Decomposition Tree, and the BRD-takeaway alignment check for Smart Narrative. The per-visual director call is ship / hide / replace — not a whole-report call. This page carries what the book cannot: curated further reading beyond Appendix C on the statistical methods underneath each visual, a five-question self-check quiz on the four per-visual moves, and a hands-on activity that runs all four moves on a real dashboard.
Use the further reading to understand what each AI visual is actually doing statistically — three of the four predate large language models, and knowing which method is running lets the analyst predict its failure modes. Use the quiz to move the four moves into reflex. Use the activity to feel the specific gap between a Copilot-visual claim and a claim you can defend.
Further reading
Docs, papers, and community sources beyond the book’s own bibliography (Appendix C, updated in errata) on the statistical methods underneath the four AI visuals.
- Microsoft Learn — Key Influencers visual. The vendor documentation for Key Influencers, including which statistical method is used (logistic or linear regression with a Wald test at p = 0.05) and which is used for the «Top segments» tab (decision-tree analysis). Reading this explicitly is what makes the confound check tractable — you know what method the ranking came from. Free at learn.microsoft.com/power-bi/visuals/power-bi-visualization-influencers.
- Microsoft Learn — Anomaly Detection visual. Documents the time-series anomaly model used, its confidence interval, and the categories of pattern it flags. Read alongside the business-context-walk move — the model has no business context, so the analyst has to supply it. Free at learn.microsoft.com/power-bi/visuals/power-bi-visualization-anomaly-detection.
- Microsoft Learn — Decomposition Tree. Documents the greedy child-selection heuristic (highest, lowest, or AI-recommended split at each step) and its filter-context sensitivity. The filter-clear re-walk move exists because the same tree with a different filter can produce a different path — that behavior is documented here. Free at learn.microsoft.com/power-bi/visuals/power-bi-visualization-decomposition-tree.
- Pearl, J., & Mackenzie, D. (2018). The Book of Why: The New Science of Cause and Effect. Basic Books. Accessible book-length treatment of the confound-vs-cause distinction the Key Influencers confound check operationalizes. The Ch 10 Asha worked example (enterprise-tier appears as a driver until the analysis is filtered to a subset where enterprise-tier and product-line overlap) is exactly a Pearl confounder story. Chapters 4 and 5 for the direct pairing.
- Datawrapper Academy — What makes a good chart title (and other narrative guidance). Practitioner writing on how narrative claims should relate to the visual evidence — the exact discipline the BRD-takeaway alignment check applies to Smart Narrative. Datawrapper’s title guidance transfers directly. Blog at academy.datawrapper.de/category/16-blog.
Last curated: 2026-07-18. Reviewed quarterly. Suggestions welcome via the errata page.
Self-check quiz
Five questions on Ch 10’s load-bearing concepts. Answer them out loud before opening the reveal.
-
Q1. Name the four AI visuals and, in one line each, the statistical method Microsoft documents underneath each.
Show answer
Key Influencers — logistic or linear regression with a Wald test at p = 0.05; decision-tree analysis for the Top segments tab. Anomaly Detection — time-series anomaly model with confidence intervals. Decomposition Tree — greedy child-selection heuristic (highest, lowest, or AI-recommended split at each step). Smart Narrative — generative summary text (the only genuinely LLM-based visual of the four; the other three predate large language models).
-
Q2. Ch 10 tells the reader to treat every AI-visual output as a claim, not a finding. What is the difference in practical terms?
Show answer
A finding is treated as true and reported; a claim is treated as a hypothesis and tested before reporting. Key Influencers producing a driver ranking is a claim (the ranking depends on the field set in Explain by; a different field set would rank differently). Anomaly Detection flagging a point is a claim (the anomaly may or may not have a business explanation). Decomposition Tree drilling to a leaf is a claim (the path depends on the filter context). Smart Narrative paragraphing is a claim (the sentences may not be what the visual shows). Treating all four as claims-not-findings is what earns the per-visual verification move.
-
Q3. For each of the four AI visuals, name the specific verification move Ch 10 prescribes.
Show answer
Key Influencers → driver confound check: vary the Explain by field set and see which drivers survive; a ranked driver that disappears under a slightly different field set is a confound, not a cause. Anomaly Detection → business-context walk: for every flagged anomaly, name the business reason (deployment, campaign, holiday, data-pipeline issue) or classify as unexplained. Decomposition Tree → filter-clear re-walk: clear all filters and re-run the drill; if the «interesting path» only holds under a specific filter, the finding is scoped to that filter and needs to be reported that way. Smart Narrative → BRD-takeaway alignment: read the narrative next to the BRD takeaway and check whether the paragraph’s emphasis matches.
-
Q4. The chapter names «filter-dependence» as a property of Decomposition Tree and Key Influencers. State the property and give one example of how it can mislead if unrecognised.
Show answer
A Decomposition Tree path or Key Influencers ranking recomputes under any change to the filter context; a path found under one filter does not necessarily survive a different one. Example: a Decomposition Tree drill under a «region = North America» filter drills through «segment = Enterprise» to a leaf about «renewal risk high.» The analyst reads this as «NA Enterprise has renewal risk.» But clear the filter and re-walk — and if the AI-recommended path now goes through a different segment entirely, the original finding was scoped to NA. Reporting it as a company-wide finding would be wrong. The filter-clear re-walk is what surfaces the scoping.
-
Q5. Ch 10 makes the per-visual director call «ship / hide / replace» rather than a single accept-or-reject decision. Why the three-way?
Show answer
Because AI visuals fail in different ways, and each failure earns a different response. Ship: the visual survived its verification move and adds signal to the report. Hide: the visual failed verification but the report ships without it — the visual is not right for this question, but no hand-built visual is needed either. Replace: the AI visual is wrong for this question and a hand-built visual takes its place — usually when the AI visual produced a confounded ranking or a filter-scoped path the audience needs the unscoped view of. Not a whole-report call because each of the four visuals on a page gets its own decision.
Asha’s escalation-driver confound check, up close
Power BI Key Influencers on Asha’s support-tickets model ranked three drivers of escalation on the AI first pass: ticket age over 7 days (4.1x), Enterprise tier (2.3x), Identity product line (1.8x). All three looked defensible. Asha ran the confound-check verification move on each in turn. Only one survived clean; one survived when scoped correctly to a feature area; one collapsed as a confound with customer size once co-Explain-by was added. The Smart Narrative got two edits; the Anomaly Detection flag got suppressed as a known monthly integration rollout; the Decomposition Tree walk carries a caveat because its path includes the Enterprise-tier confound.
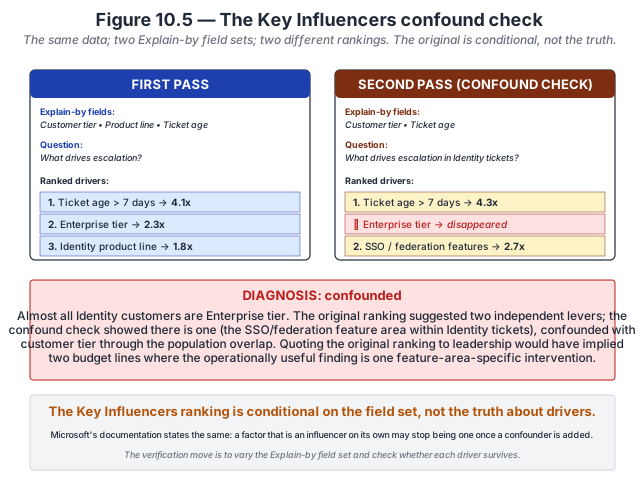
- The confound-check is the verification move for Key Influencers. Key Influencers surfaces drivers conditional on the field set the analyst chose for Explain-by. Adding a plausibly-related field (customer size, tenure, product mix) as a co-Explain-by field and re-running is the discipline that separates real drivers from proxies for something else.
- The Enterprise-tier collapse is diagnostic. The effect fell from 2.3x to ~1.2x once customer size was included — that magnitude of collapse tells Asha the tier was serving as a proxy. Do not surface as an escalation driver; add a caveat to the report’s working file.
- The Identity survival tells a scoping story, not a truth story. The 1.8x effect held at ~1.9x when scoped to the SSO/federation feature area but did not hold for the product line as a whole. Report as «SSO/federation feature area» rather than «Identity product line» to avoid overclaiming.
- The three visuals must be verified independently. Smart Narrative edits, Anomaly Detection suppression, and the Decomposition Tree caveat are three different verification moves because the three visuals use three different algorithms. Chapter 10 walks the discipline in Per-visual triage.
Inspect the drivers. All three drivers with their raw multiplier, verification move, verified verdict, and follow-up action are available as a flat CSV. Download asha-escalation-drivers.csv · Dataset README and schema.
Try this activity — run all four verification moves on a real dashboard
This activity walks the four per-visual moves against a dashboard that includes all four AI visuals. Total time: 45–60 minutes; requires Power BI + Copilot-ready capacity.
-
Build the dashboard. Against the CloudRevenue dataset, create a new report page and add all four AI visuals: Key Influencers (target: churn; explain by all customer attributes), Anomaly Detection (on monthly services revenue), Decomposition Tree (start on services revenue, AI-recommended splits), and Smart Narrative (on the whole page). Let each render with its default configuration.
-
Run the Key Influencers confound check. Note the top three drivers. Now edit the Explain by field set — remove one high-cardinality attribute (like tenant ID). Refresh. Note whether the top three drivers changed. Repeat with a second field set change. Any driver that survives all three variants is more defensible; any driver that disappears is a candidate confound.
-
Run the Anomaly Detection business-context walk. For each anomaly Copilot flagged, write one sentence naming the business reason (a real explanation from ops or product) or classify it as unexplained. Any anomaly you cannot explain is a hypothesis to check, not a finding to report. If more than half are unexplained, the anomaly model may be over-flagging; adjust the sensitivity setting.
-
Run the Decomposition Tree filter-clear re-walk. Apply a filter (e.g., region = Americas) and walk the AI-recommended path to a leaf. Note the path. Now clear the filter and re-walk. If the AI-recommended path changes, the original finding was scoped to the filter — report it that way or drop it. If the path is the same, the finding is more robust across filter contexts.
-
Run the Smart Narrative BRD-takeaway alignment check. Read the Smart Narrative paragraph next to your Big Idea for the dashboard. Compare: (a) does the narrative name the same primary claim as your Big Idea? (b) does it name any causal reason the visual does not visibly demonstrate? (c) does it emphasise a secondary claim that the audience will read as primary? If any of the three, the narrative is a narrative-drift candidate.
-
Make the per-visual ship / hide / replace call. For each of the four visuals, write the decision and the deciding evidence check. Example: «Key Influencers: ship. Top driver (contract length) survived two field-set variations. Second and third drivers (region, product line) hide — both flipped under variation; would need model-side disambiguation to become defensible.»
-
Reflect (three prompts). Write one sentence in response to each:
- Which of the four verification moves surfaced the biggest gap between claim and finding?
- Which visual, if any, would you consistently replace with a hand-built alternative on this dashboard?
- How would you standardise the four moves as a pre-ship gate on your team’s workflow?
The reflection is the activity’s payoff. Skipping it turns the exercise into paperwork.
Optional extension: repeat the Key Influencers confound check on a real production dashboard your team relies on. Confound-check results are often surprising — a «strong driver» that disappears under variation is a finding that has been shaping operational decisions on false confidence.
Related site resources
- CloudRevenue dataset: the dataset the activity above runs against.
- Chart Gallery: the gallery’s AI-visuals section documents the four visuals with worked-example screenshots and per-visual failure signatures.
- Prompt Library: the Refine-direction patterns for narrowing Key Influencers Explain by, adjusting Anomaly sensitivity, and requesting alternative Decomposition Tree splits.
- Chapter 9 companion: the previous chapter — wrong-narrative failure at the report level generalises here to the cross-visual per-visual verification move.
- Chapter 11 companion: the next chapter — Prep-for-AI investment that makes Copilot Q&A defensible.
- Chapter 13 companion: the cross-surface generalisation of the failure modes surfaced here; Ch 13’s five-diagnostics scoring uses this chapter’s outputs as input.
Cited in the book
Chapter 10’s bibliography lives in the book’s Appendix C (living version in errata). The chapter’s operative references:
- Microsoft Learn — per-visual documentation for Key Influencers, Anomaly Detection, Decomposition Tree, and Smart Narrative (URLs above under Further reading).
- Pearl, J., & Mackenzie, D. (2018). The Book of Why. Basic Books. The confound-vs-cause discipline behind the Key Influencers confound check.